If you’re venturing into the world of finance, whether for personal knowledge or business needs, understanding an income sheet is essential. Often referred to as an income statement, this financial report provides a clear snapshot of a company’s profitability over a specific period. It’s a key document used by businesses, investors, lenders, and analysts to assess the financial health of a company.
In this guide, we’ll break down the key components of an income sheet, explain how each part functions, and provide a real-world example to help you better understand how to read it. Whether you’re a business owner, student, or investor, this article will ensure you gain the skills to make sense of the figures that matter most to your financial decisions.
Contents
What Is an Income Sheet?

An income sheet (also known as an income statement or profit and loss statement) is a financial document that summarizes a company’s revenues, expenses, and profits or losses over a specified period, typically a quarter or year. It is a vital tool that shows how well a company is performing by detailing the inflow of revenue and outflow of expenses, ultimately resulting in net income or a loss.
In short, it answers two critical questions:
-
How much money is the company making?
-
How much money is the company spending?
At the most basic level, an income sheet follows the equation:
Revenue – Expenses = Net Income
This simple equation is the backbone of every income statement, helping business owners, investors, and analysts evaluate a company’s operational efficiency and profitability.
Why Is an Income Sheet Important?
Understanding your income sheet is essential for several reasons:
-
Profitability: It gives a clear view of a company’s profitability and how much income it’s generating compared to its expenses.
-
Financial Health: Investors and lenders use it to assess the company’s ability to generate profits and repay debts.
-
Performance Measurement: By comparing income sheets across different periods, a company can measure its performance, identify trends, and make informed decisions.
-
Operational Efficiency: It highlights areas of inefficiency and allows businesses to take action to reduce unnecessary costs.
Ultimately, the income sheet is a crucial tool for financial decision-making.
Key Components of an Income Sheet
To fully understand the income sheet, it’s important to break it down into its major components. Let’s take a closer look at each part:
1. Revenue (Sales)
The first component of any income sheet is revenue, also called sales or top-line income. This represents the total amount of money a company earns from its business activities during the reporting period. It includes the sales of goods and services, before any expenses are deducted.
-
Gross Revenue: The total amount of sales before any deductions.
-
Net Revenue: This is gross revenue minus returns, discounts, and allowances. Net revenue reflects the actual income that a company retains from sales.
Revenue is crucial because it sets the foundation for the rest of the income statement. It shows the company’s ability to generate income from its core operations.
2. Cost of Goods Sold (COGS)
After revenue comes the cost of goods sold (COGS), also known as the direct costs associated with producing goods or services sold by the company. These are the expenses directly tied to the production process, such as raw materials, direct labor, and factory overhead.
The equation for calculating gross profit is:
Gross Profit = Revenue – COGS
Gross profit indicates the efficiency of the company in producing and selling its goods and services.
3. Gross Profit
Gross profit represents the difference between total revenue and the direct costs (COGS). It provides insight into how much a company is earning from its core activities, before accounting for other operating expenses, taxes, and interest.
A strong gross profit margin is a good indicator that the company is managing its production costs effectively.
4. Operating Expenses
Next comes operating expenses, which are the costs associated with running the day-to-day business but aren’t directly tied to the production of goods or services. These include:
-
Selling, General, and Administrative Expenses (SG&A): These are indirect costs like rent, salaries of employees not involved in production, marketing, and office supplies.
-
Research and Development (R&D): Costs incurred in developing new products or services.
-
Depreciation: The gradual reduction in value of fixed assets like buildings, machinery, or equipment.
The total operating expenses are subtracted from gross profit to calculate operating income.
5. Operating Income
Operating income, also known as operating profit or EBIT (Earnings Before Interest and Taxes), is a critical metric. It represents the profit generated from the core business operations, excluding interest and taxes.
Operating income is derived from:
Operating Income = Gross Profit – Operating Expenses
This figure gives a clear picture of how well the company is performing in its primary business operations, without the influence of external factors like financing or taxation.
6. Other Income and Expenses
This section includes any income or expenses that don’t directly relate to the core operations of the business. Examples include:
-
Interest income: Earnings from investments.
-
Interest expenses: Costs of servicing debt.
-
Gains or losses from asset sales: Profit or loss from the sale of assets like real estate or equipment.
These non-operating income and expenses are subtracted or added to operating income to calculate pre-tax income.
7. Pre-Tax Income (EBT)
Pre-tax income (also known as earnings before tax, or EBT) represents the total profit of the company before accounting for income taxes. This figure includes both operating income and other income/expenses. Pre-tax income is important because it shows how well the company is performing without the effect of tax rates.
8. Income Tax Expense
Next comes the income tax expense, which represents the taxes the company must pay on its earnings. Taxes are subtracted from pre-tax income to calculate the final net income.
9. Net Income
Finally, we arrive at net income—the “bottom line” of the income sheet. This is the final profit or loss a company made during the period after all expenses, including taxes, have been deducted from revenue. Net income tells investors, business owners, and analysts whether the company is profitable or operating at a loss.
The formula for net income is:
Net Income = Pre-Tax Income – Income Tax Expense
A positive net income means the company has earned more than it spent, while a negative net income means the company has lost money.
Example of an Income Sheet
Now that we’ve gone over the components, let’s look at a simplified income sheet example for a fictional company, XYZ Inc., for the fiscal year ending December 31, 2024:
XYZ Inc. Income Sheet (Fiscal Year 2024)
| Category | Amount ($) |
|---|---|
| Revenue | 500,000 |
| Cost of Goods Sold (COGS) | 250,000 |
| Gross Profit | 250,000 |
| Operating Expenses | |
| Selling, General & Administrative | 80,000 |
| Research & Development | 20,000 |
| Depreciation | 15,000 |
| Total Operating Expenses | 115,000 |
| Operating Income | 135,000 |
| Other Income | 5,000 |
| Pre-Tax Income (EBT) | 140,000 |
| Income Tax Expense | 35,000 |
| Net Income | 105,000 |
How to Use the Income Sheet for Business Decision-Making
Understanding your income sheet helps you make more informed decisions as a business owner, investor, or financial analyst. Here are a few ways to use it effectively:
-
Track Profitability: By regularly reviewing your income sheet, you can track whether your business is becoming more profitable over time.
-
Identify Cost-Cutting Opportunities: If you see your operating expenses rising without a corresponding increase in revenue, it might be time to review costs and make adjustments.
-
Make Investment Decisions: Investors can use the income sheet to assess whether a company is profitable and has the potential for future growth.
-
Plan for Taxes: Understanding your pre-tax income helps you plan for income taxes and avoid surprises at the end of the year.
Conclusion
An income sheet is one of the most powerful tools in financial reporting. Whether you’re a business owner managing your company’s performance, an investor evaluating potential opportunities, or someone looking to understand financial documents better, grasping the components of the income sheet is crucial.
By understanding the key elements—revenue, expenses, operating income, and net income—you gain valuable insights into a company’s financial health. This knowledge can help you make informed decisions, track profitability, and ensure long-term financial stability.
FAQs about Income Sheets
Q: How often should a company update its income sheet?
A: Income sheets are typically updated quarterly and annually, although they can be prepared monthly for internal use.
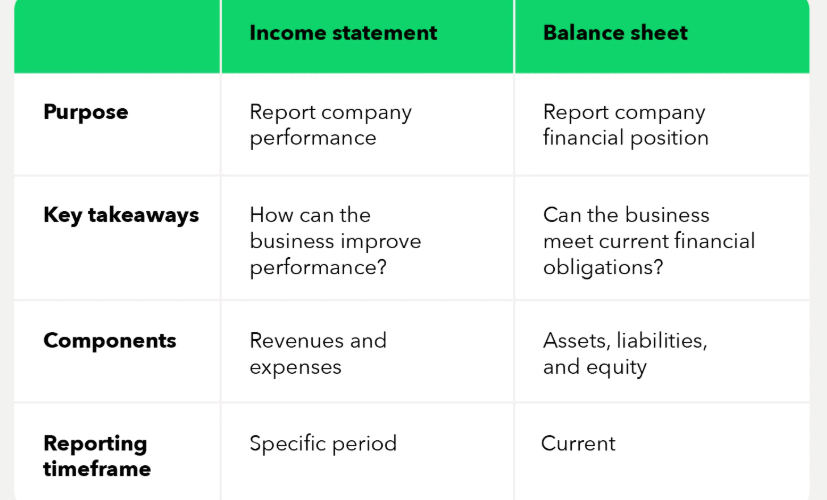
Q: What’s the difference between an income sheet and a balance sheet?
A: An income sheet shows a company’s profitability over a specific period, while a balance sheet shows the company’s assets, liabilities, and equity at a specific point in time.
Q: Can an income sheet be used to predict future profits?
A: While an income sheet offers historical data, it can be used to identify trends and provide insights for future financial performance.