A balance sheet is one of the most essential financial statements used by businesses, investors, lenders, and financial analysts to understand a company’s financial health. Whether you’re a small business owner, a student, or a savvy investor, learning how to read a balance sheet can help you make informed decisions.
In this easy-to-read, step-by-step guide, we’ll walk you through everything you need to know about balance sheets—from basic definitions to real-world examples. By the end, you’ll feel confident interpreting a balance sheet and understanding what the numbers truly mean.
Contents
- 1 What Is a Balance Sheet?
- 2 Why the Balance Sheet Matters
- 3 The Three Core Components of a Balance Sheet
- 4 How to Read a Balance Sheet: Step-by-Step
- 5 Real-World Balance Sheet Example
- 6 Common Red Flags to Watch For
- 7 Tips for Analyzing a Balance Sheet
- 8 Balance Sheet in Financial Modeling
- 9 FAQs About Balance Sheets
- 10 Final Thoughts
What Is a Balance Sheet?

A balance sheet (also known as a statement of financial position) is a snapshot of a company’s financial position at a specific point in time. It shows what the company owns (assets), what it owes (liabilities), and the value left for the owners (equity).
Think of a balance sheet as a scorecard that reveals whether a company is financially healthy or struggling.
The fundamental equation behind a balance sheet is:
Assets = Liabilities + Equity
This equation must always be in balance—hence the name “balance sheet.”
Why the Balance Sheet Matters
The balance sheet helps you:
- Understand a company’s liquidity and solvency
- Measure how efficiently a company uses its resources
- Analyze financial risk
- Compare financial performance over time or against competitors
It’s a powerful tool for anyone making financial decisions. The financial statement provides clarity and insight, enabling smarter choices.
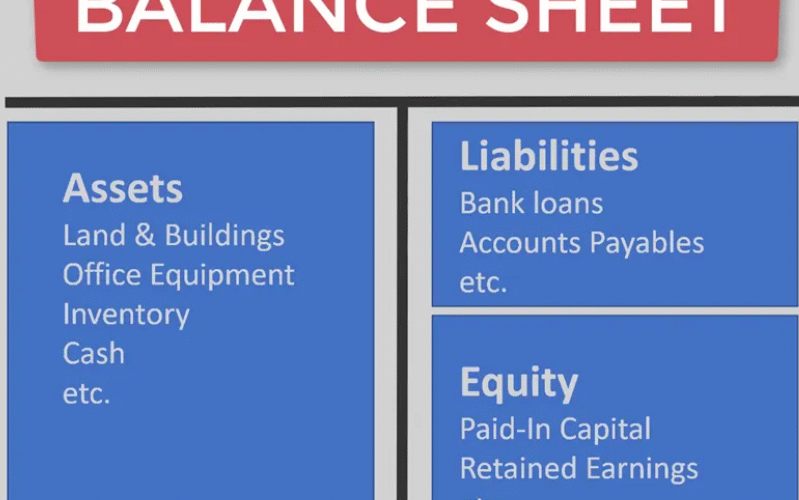
The Three Core Components of a Balance Sheet
Let’s break down the three key parts of a balance sheet.
1. Assets
Assets are everything the company owns. These are split into two main categories:
- Current Assets: Items that can be converted into cash within a year.
- Cash and cash equivalents
- Accounts receivable
- Inventory
- Prepaid expenses
- Non-Current Assets: Long-term investments and assets.
- Property, plant, and equipment (PP&E)
- Intangible assets (like patents and trademarks)
- Investments
2. Liabilities
Liabilities are what the company owes.
- Current Liabilities: Debts due within a year.
- Accounts payable
- Short-term loans
- Accrued expenses
- Long-Term Liabilities: Obligations due in more than a year.
- Bonds payable
- Long-term loans
- Deferred tax liabilities
3. Equity
Equity is the value that belongs to the owners after all liabilities are paid.
- Common stock
- Retained earnings
- Additional paid-in capital
Equity can be thought of as the company’s net worth. On the balance sheet, equity shows the company’s ability to finance itself without relying on debt.
How to Read a Balance Sheet: Step-by-Step
Step 1: Look at the Reporting Date
Balance sheets are prepared at a specific point in time, often at the end of a quarter or fiscal year. Check the date to understand the timeframe. Knowing when the balance sheet was created gives context to the numbers.
Step 2: Review Assets
Start with current assets. Are they enough to cover current liabilities?
Then look at non-current assets. Are they significant? This can indicate investment in long-term growth. Total assets on a financial statement reveal the company’s scale and resource base.
Step 3: Examine Liabilities
Are current liabilities high compared to current assets? This could mean short-term financial stress.
Look at long-term liabilities too. A company with high debt may be risky. The financial statement tells you if the company is overleveraged.
Step 4: Evaluate Equity
Is equity positive? A negative equity may signal financial trouble.
Compare equity trends over time. Growing equity generally reflects a healthy business. The equity section of the financial statement provides insight into retained profits and capital raised.
Step 5: Use Ratios
Financial ratios help interpret the numbers more clearly:
- Current Ratio = Current Assets / Current Liabilities (liquidity)
- Debt-to-Equity Ratio = Total Liabilities / Total Equity (leverage)
- Return on Equity (ROE) = Net Income / Shareholder’s Equity (profitability)
These ratios transform raw balance sheet data into actionable insights.
Real-World Balance Sheet Example
Let’s look at a simplified financial statement for a fictional company, “ABC Corp,” as of December 31, 2024.
ABC Corp Balance Sheet (as of Dec 31, 2024)
| Assets | Amount ($) |
|---|---|
| Current Assets | |
| Cash | 50,000 |
| Accounts Receivable | 40,000 |
| Inventory | 60,000 |
| Total Current Assets | 150,000 |
| Non-Current Assets | |
| Property, Plant & Equipment | 250,000 |
| Intangible Assets | 30,000 |
| Total Non-Current Assets | 280,000 |
| Total Assets | 430,000 |
| Liabilities and Equity | Amount ($) |
| Current Liabilities | |
| Accounts Payable | 30,000 |
| Short-Term Loans | 20,000 |
| Total Current Liabilities | 50,000 |
| Long-Term Liabilities | 100,000 |
| Total Liabilities | 150,000 |
| Equity | |
| Common Stock | 100,000 |
| Retained Earnings | 180,000 |
| Total Equity | 280,000 |
| Total Liabilities + Equity | 430,000 |
Notice how total assets = total liabilities + equity? That’s the balance sheet equation in action.
Common Red Flags to Watch For
- Negative Equity: When liabilities exceed assets.
- High Debt: A high debt-to-equity ratio may signal risk.
- Low Liquidity: If current liabilities are greater than current assets.
- Large Intangibles: May indicate overvalued goodwill or acquisitions.
- Irregular Trends: Significant year-over-year changes should be explained.
Identifying these issues through the financial statement helps avoid financial surprises.
Tips for Analyzing a Balance Sheet
- Compare multiple years to identify trends.
- Review alongside the income statement and cash flow statement.
- Understand the business model tech companies may have few tangible assets but high equity.
- Look at industry averages for better benchmarking.
- Examine how financial statement components interact with business strategy.
Balance Sheet in Financial Modeling
In financial modeling, the financial statement—or statement of financial position—is crucial for projecting future financial health. Analysts build models to forecast:
- Growth
- Cash needs
- Valuation metrics
Understanding the statement structure is essential in predicting outcomes accurately. Every solid financial model depends on a strong grasp of the financial statement.
FAQs About Balance Sheets
Q: Is the balance sheet the same as a financial statement?
A: It’s one type of financial statement, along with the income statement and cash flow statement.
Q: How often are balance sheets prepared?
A: Most companies prepare them quarterly and annually.
Q: What does a healthy balance sheet look like?
A: Strong current assets, manageable debt, and consistent or growing equity.
Q: Can a balance sheet predict company success?
A: It offers strong clues, especially when compared over time or with competitors.
Q: Who uses balance sheets?
A: Investors, lenders, business owners, analysts, accountants, and regulators.
Final Thoughts
Learning how to read a balance sheet also known as a statement of financial position is an invaluable skill. Whether you’re analyzing your own business or investing in others, understanding what’s behind the numbers empowers better decisions.
From knowing what assets and liabilities mean, to using key ratios and spotting red flags, this guide gives you the foundation you need to read any financial statement with confidence.
Now that you’ve learned how to read a financial statement, try analyzing one on your own. Start with a company you admire or your own business. The more you practice, the better you’ll get at interpreting financial health at a glance.