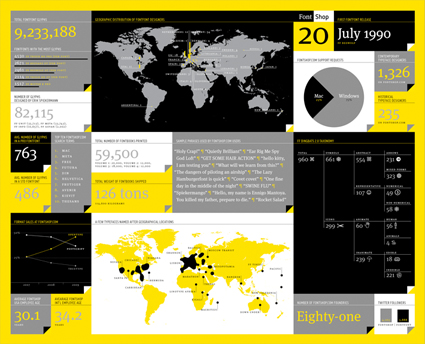
Typography and infographics are two powerful elements in design and communication that, when combined effectively, can result in visually appealing and information-rich content. Typography, the art and technique of arranging type to make written language legible and aesthetically pleasing, and infographics, which use visual elements to represent data, have become indispensable tools in the world of design, marketing, and communication. When these two design elements converge, they create a dynamic synergy that not only enhances the overall appeal of the content but also makes complex information more accessible and engaging.
In this article, we will explore the relationship between typography and infographics, discussing how they come together to create meaningful and visually captivating designs. We’ll delve into the key principles, best practices, and real-world examples to illustrate the art of marrying typography and infographics effectively.
Contents
The Role of Typography in Infographics
Typography serves as the backbone of any infographic design. It is through typography that the content is communicated, and it plays a crucial role in setting the tone, conveying the message, and guiding the viewer’s attention. Here are some key aspects of typography in infographics:
- Hierarchy and Readability: A well-designed infographic utilizes typography to establish a clear hierarchy of information. This hierarchy ensures that the most critical content is prominently displayed, making it easy for viewers to quickly grasp the main message. Headings and subheadings are typically used to distinguish different sections, while body text provides detailed information.
- Font Selection: The choice of fonts is critical in infographic design. Different fonts convey various emotions and characteristics. For example, sans-serif fonts like Helvetica can create a modern and clean look, while serifs like Times New Roman evoke a more traditional and formal feel. The font used should align with the content and the brand’s identity.
- Contrast and Emphasis: Typography allows designers to create emphasis and contrast within an infographic. By using various font weights (bold, italic) and sizes, designers can draw attention to key points or data. This not only guides the viewer but also adds a layer of visual interest.
- Consistency: Maintaining a consistent typography style throughout the infographic is essential for visual harmony. This includes using the same font family, sizes, and color schemes. Consistency ensures that the infographic feels cohesive and professional.
The Integration of Typography and Visual Elements
The successful fusion of typography and visual elements is where the magic happens in typography-infographic design. When done right, this combination can transform complex data into an engaging and easy-to-understand visual story. Here’s how this integration works:
- Graphic Elements: Infographics often feature icons, illustrations, charts, and images to support the textual content. Typography works in tandem with these elements by providing labels, captions, and explanations. The relationship between text and visuals should be harmonious, with text guiding the viewer through the graphics.
- Color and Typography: Color plays a significant role in creating visual interest and reinforcing the message in an infographic. Typography can be used to harmonize with the chosen color scheme. For instance, using complementary colors for text and background can enhance readability and overall aesthetics.
- Balance and Proportion: Achieving a balanced composition is vital in infographic design. Typography helps maintain this balance by ensuring that text elements are distributed evenly across the graphic. Proper proportion of text to graphics ensures that the viewer is not overwhelmed with information.
Examples of Typography-Infographic Integration
Let’s take a look at some real-world examples to better understand the power of typography-infographic integration:
- Coca-Cola’s History Timeline: Coca-Cola’s historical infographic features a timeline with bold, sans-serif typography. The text is expertly integrated into the visual timeline, allowing viewers to follow the company’s journey through the years.
- COVID-19 Vaccine Efficacy: During the COVID-19 pandemic, many organizations created infographics to convey vaccine efficacy. These often included clear, large typography to communicate vital statistics, making the information accessible and reassuring.
- Travel Destination Infographics: Travel agencies often create infographics to promote destinations. These infographics combine stunning images with typography to highlight key attractions, travel tips, and cultural information, creating an enticing visual narrative.
Conclusion
Typography and infographics are powerful tools in design and communication. When they meet, they create an exceptional blend of form and function. Effective typography in infographics establishes hierarchy, maintains readability, and enhances content presentation. The integration of typography and visual elements transforms data into engaging stories. By carefully choosing fonts, using color effectively, and ensuring balance and proportion, designers can craft visually appealing and informative infographics that capture and hold the viewer’s attention.
As our world becomes increasingly visual and information-dense, the art of combining typography and infographics will continue to be a valuable skill for designers and communicators, ensuring that complex data remains accessible and compelling to a broad audience.
